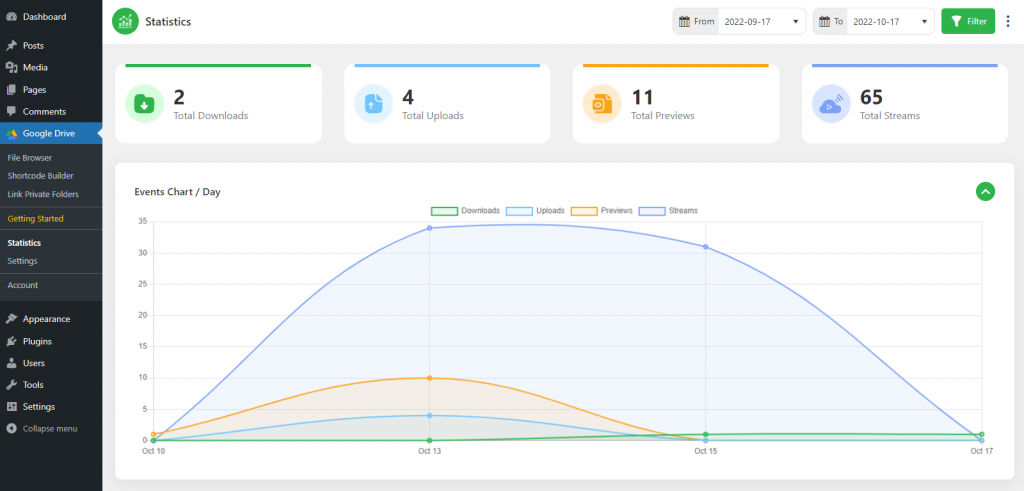
From the statistics page, you can view & track the overall performance of your files, folders, and documents – downloads, uploads, and previews. Such as streams of top downloads, top users with the most downloads, top uploads, top users with the most uploads, top previews, top users with most previews, top streams, top users with most streams, and all event logs.
Here are the details that you can cross-check from the statistics page:
- Total Downloads: Count of all files downloaded, showcasing the popularity of content on the platform.
- Total Uploads: A tally of all the content uploaded, reflecting the creativity and contributions from users.
- Total Previews: The number of times content has been previewed, revealing what’s caught the eye of the audience.
- Total Streams: The total streams across all content, highlighting the most engaging media on the platform.
- Events Chart / Day: A daily snapshot of activity in a chart diagram, tracking the pulse of user engagement in real time.
- Top Downloads: The most downloaded content, marking the community’s favorites and trending files.
- Top Users with Most Downloads: The individuals leading the charge with the highest number of downloads.
- Top Uploads: The most uploaded content, showcasing the community’s active contribution.
- Top Users with Most Uploads: The top contributors upload the most content to keep the platform fresh.
- Top Previews: The most previewed files, show what everyone’s curious about and exploring.
- Top Users with Most Previews: The users whose content has intrigued the most viewers with a lot of previews.
- Top Streams: The content with the most streams, indicating the most viewed and popular media.
- Top Users with Most Streams: The users whose content keeps getting streamed time and again, making waves.
- Top Searches: The most searched keywords and topics, reveal the trending interests of the platform.
- Top Users with Most Searches: The users driving the most search activity, sparking curiosity and engagement.
- All Event Logs: A detailed record of all activities, offering a complete look at overall records of the statistics data.

How to Enable Integrate Google Drive Statistics?
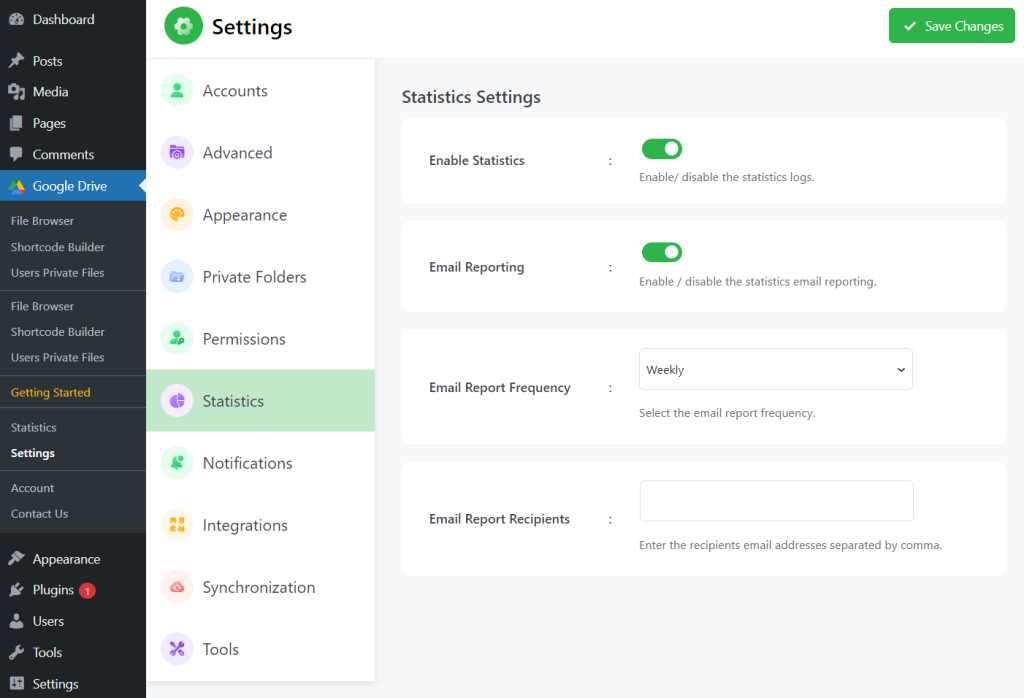
Enabling statistics is super easy. From Integrate Google Drive dashboard click Settings > Statistics > Enable Statistics.
- Email Reporting: Enable/ disable the statistics of email reporting.
- Email Report Frequency: You can set email reporting frequency as daily weekly or monthly.
- Email Report Recipients: Enter the recipient’s email addresses where you want to get email reports. Enter multiple email addresses by using comma separates. Save Changes Once everything is done.

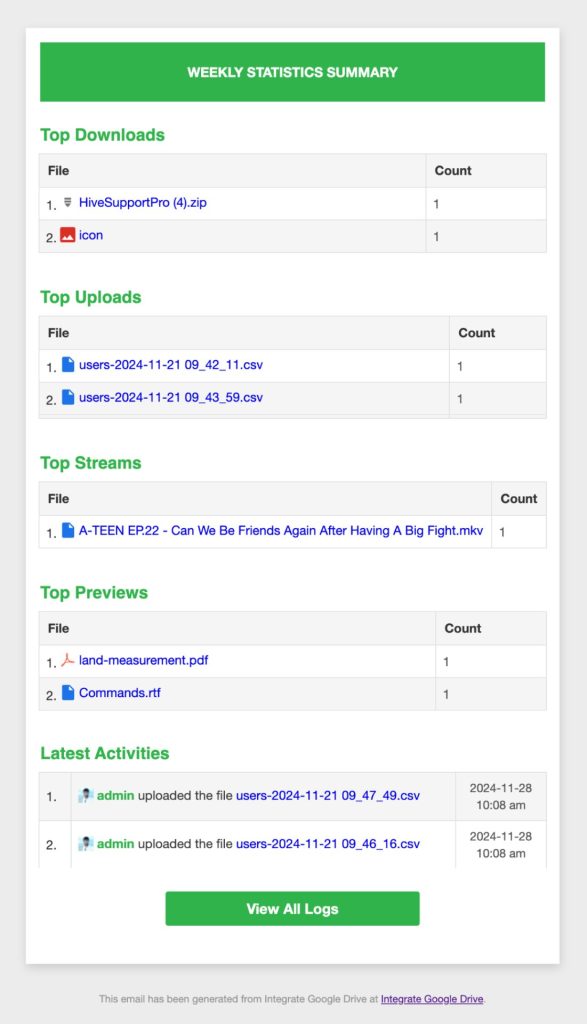
Email Reporting Output
